
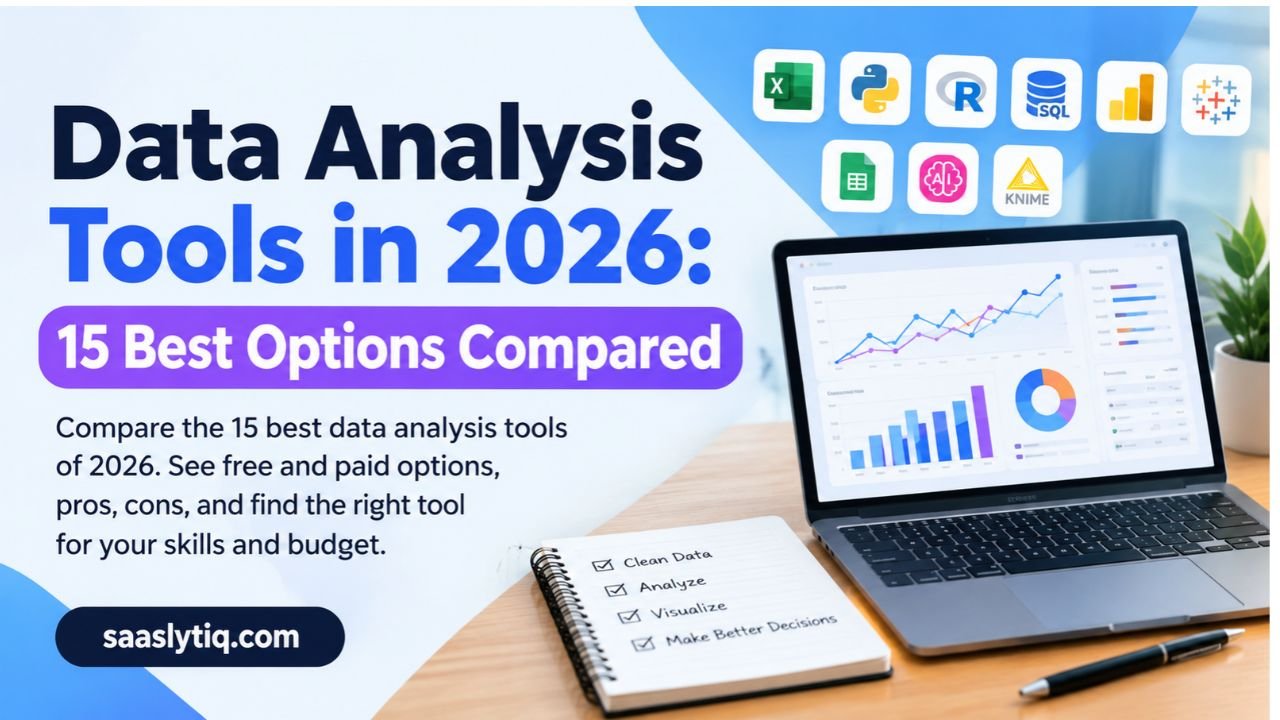
Data analysis tools help you turn raw numbers into clear answers. You might track sales, study survey results, or report on website traffic. The right tool saves you hours of work and helps you make better decisions. The wrong tool wastes your time and money. That is why choosing carefully matters.
The choice is not easy today. Hundreds of options exist. Some are simple spreadsheets like Excel and Google Sheets. Others are programming languages like Python, R, and SQL. Many are dashboard tools like Power BI and Tableau. New AI tools now let you ask questions in plain English and get answers in seconds. Each tool does a different job. No single tool is best for everyone.
This guide makes the choice simple. You will learn what data analysis tools are, how the main types differ, and which tools fit your skills, budget, and goals. We compare 15 popular tools in easy tables. We also cover free options, AI tools, and the best picks for beginners, marketers, and researchers. We update this guide in October 2026, so the information stays current. Read on and find the right tool for your work.
What Are Data Analysis Tools?
Data analysis tools are software programs that help you collect, clean, study, and present data. They turn raw numbers into useful insights. You can then use those insights to make smart decisions.
Think of a kitchen. A chef does not use one tool for every task. A knife chops, a blender mixes, and an oven bakes. Data analysis works the same way. Excel handles quick calculations. SQL pulls data from a database. Python cleans messy files and builds models. Power BI and Tableau turn numbers into dashboards that anyone can read.
Many people use the terms “data analysis tools” and “data analytics tools” as the same thing. In daily work, they mean almost the same. Both groups help you find patterns, spot trends, and answer business questions.
What Do Data Analysis Tools Do?
Most tools do one or more of four main jobs. The table below shows each job in simple terms.
| Job | What it means | Example tools |
| Data cleaning | Fix errors, remove duplicates, and fill gaps | Excel, Python (pandas), KNIME |
| Data analysis | Find averages, trends, and links between numbers | R, SPSS, SQL |
| Data visualization | Show results in charts, graphs, and dashboards | Tableau, Power BI, Looker Studio |
| Predictive analytics | Use past data to forecast future results | Python, SAS, RapidMiner |
Some tools cover all four jobs. Others do only one. For example, Python can clean, analyze, and predict. Tableau focuses mainly on visualization.
Who Uses Data Analysis Tools?
Many professionals use these tools every day. Data analysts study trends and write reports. Business analysts improve company processes. Digital marketers track campaigns in Google Analytics. Researchers test ideas with statistical software. Data scientists build machine learning models.
You do not need a technical degree to start. Beginners can learn Excel or Google Sheets in a few days. You can then move to SQL, Python, or a dashboard tool as your skills grow.
Now that you know the basics, let’s look at the main types of data analysis tools and how they differ.
Types of Data Analysis Tools
Not all data analysis tools work the same way. Some are built for beginners. Others need coding skills. Some handle small files, and others process millions of rows. Knowing the main types helps you pick the right one faster.
Here are the eight main types, explained in simple terms.
1. Spreadsheet Tools
Spreadsheets are the easiest way to start. You type data into rows and columns. You then use formulas, pivot tables, and charts to study it.
Microsoft Excel and Google Sheets lead this group. Excel offers extra features like Power Query and Power Pivot. Google Sheets lets many people edit one file at the same time. Both work well for small and medium datasets. They slow down when files get very large.
2. Programming Languages
Programming languages give you the most control. You write code to clean, analyze, and visualize data.
Python is the most popular choice. Libraries like pandas, NumPy, and Matplotlib make data work faster. R is another strong option. Statisticians love it for its charts and packages like ggplot2 and dplyr. SQL is different. It pulls and organizes data inside databases such as MySQL and PostgreSQL. Most data analyst jobs ask for SQL.
3. Business Intelligence and Dashboard Tools
Business intelligence (BI) tools turn data into interactive dashboards. You click, filter, and explore without writing much code.
Power BI, Tableau, Looker, and Qlik are the big names here. Teams use them to share live reports with managers and clients. Tableau is known for beautiful visuals. Power BI works smoothly with Excel and other Microsoft products.
4. Visual Data Mining Tools
These tools use a drag-and-drop screen. You connect blocks to build a workflow. You do not need to write code.
KNIME, Orange, and RapidMiner belong to this group. They suit beginners who want to try data mining and machine learning. KNIME is free and open-source, which makes it popular with small teams.
5. Statistical Software
Statistical software helps you test ideas with proof. You can run regression, hypothesis tests, and other advanced methods.
SPSS, SAS, Stata, Minitab, and JASP are common picks. Students and researchers use them often. SAS and SPSS are paid products. JASP is free and easy to learn.
6. Big Data Tools
Big data tools handle huge datasets that normal software cannot open.
Apache Spark processes large data across many computers. Snowflake and Google BigQuery store and query data in the cloud. The tool dbt helps teams transform data inside a data warehouse. Data engineers use these tools more than beginners do.
7. Notebook Tools
Notebooks mix code, notes, and charts in one page. You can explain each step as you work.
Jupyter Notebook is the best-known example. It runs in your browser and supports Python and R. Analysts use it to share projects and teach others.
8. AI-Powered Tools
AI tools are the newest group. You ask a question in plain English, and the tool does the work. It can write code, clean data, and build charts for you.
ChatGPT data analysis, Tableau AI, and Google Cloud AutoML fall in this group. They save time, but you must still check the results. AI can make mistakes. Also, avoid uploading private company data to tools you do not trust.
Summary Table: Types of Data Analysis Tools
| Type | Best for | Example tools | Coding needed? | Skill level |
| Spreadsheets | Quick analysis and small reports | Excel, Google Sheets | No | Beginner |
| Programming languages | Flexible and deep analysis | Python, R, SQL | Yes | Intermediate |
| BI and dashboards | Interactive business reports | Power BI, Tableau, Looker, Qlik | Low | Beginner to intermediate |
| Visual data mining | Drag-and-drop workflows | KNIME, Orange, RapidMiner | No | Beginner |
| Statistical software | Research and testing | SPSS, SAS, Stata, JASP | Mixed | Intermediate |
| Big data tools | Very large datasets | Apache Spark, Snowflake, BigQuery, dbt | Yes | Advanced |
| Notebooks | Sharing code and results | Jupyter Notebook | Yes | Intermediate |
| AI-powered tools | Fast answers in plain English | ChatGPT, Tableau AI, AutoML | No | Beginner |
Which Type Should You Pick?
Start with your goal and your skills. If you are new, begin with a spreadsheet. If you want a data analyst job, add SQL and Python. If you build reports for a team, learn Power BI or Tableau. Most professionals use two or three types together, not just one.
Next, we will compare the 15 best data analysis tools one by one, with pros, cons, and best uses.
15 Best Data Analysis Tools in 2026
You now know the main types of tools. Let’s look at the best ones. We picked these 15 tools for three reasons. They are popular, they are useful, and they suit different skill levels. Each tool has a short verdict, its best use, pros, cons, and a price tier.
Prices change often, so check each official website before you buy.
Quick Look: Our Top Picks
| Need | Best tool |
| Easiest to start | Microsoft Excel or Google Sheets |
| Best for a data analyst career | SQL and Python |
| Best for dashboards | Power BI or Tableau |
| Best free reporting tool | Looker Studio |
| Best for research | SPSS or R |
| Best for no-code work | KNIME |
| Best for huge datasets | Apache Spark |
| Best for fast answers | ChatGPT data analysis |
Spreadsheet Tools
1. Microsoft Excel
Verdict: Excel is still the king of everyday data work.
Best for: Beginners, small datasets, and quick reports.
Pros:
- Most people already know how to use it.
- Pivot tables sum up large tables in seconds.
- Power Query and Power Pivot add extra strength.
Cons:
- It slows down with very large files.
- Manual work can cause formula errors.
Price tier: Paid. A limited free web version exists.
2. Google Sheets
Verdict: Sheets is Excel’s free and friendly cloud cousin.
Best for: Team projects and light analysis.
Pros:
- It is free with a Google account.
- Many people can edit one file at the same time.
- It connects easily to Looker Studio and Google Analytics.
Cons:
- It handles less data than Excel.
- It has fewer advanced features.
Price tier: Free.
Programming Tools
3. Python
Verdict: Python is the most flexible tool on this list.
Best for: Data cleaning, automation, machine learning, and custom charts.
Pros:
- The language is easy to read and learn.
- Libraries like pandas, NumPy, and Matplotlib do the heavy work.
- A huge community helps you fix problems.
Cons:
- You must learn to code.
- It can run slower than some other languages.
Price tier: Free and open-source.
4. R
Verdict: R is built for statistics and strong visuals.
Best for: Researchers, students, and statisticians.
Pros:
- Packages like ggplot2 and dplyr create clean charts and tidy data.
- CRAN offers thousands of free packages.
- RStudio makes coding easier.
Cons:
- It is harder to learn than Python.
- It uses more memory on big files.
Price tier: Free and open-source.
5. SQL
Verdict: SQL is a must-have skill for any analyst.
Best for: Pulling and organizing data from databases.
Pros:
- Nearly every company uses databases.
- Tools like MySQL and PostgreSQL are free.
- Job posts ask for SQL again and again.
Cons:
- It does not make charts by itself.
- It works best with structured data.
Price tier: Free. Some database products cost money.
Visualization and BI Tools
6. Microsoft Power BI
Verdict: Power BI gives you strong dashboards at a fair price.
Best for: Business reports and teams that use Microsoft products.
Pros:
- It connects to Excel, SQL databases, and cloud sources.
- It has a gentle learning curve.
- It gets regular updates.
Cons:
- Its formula language, DAX, takes time to learn.
- The free version has limits.
Price tier: Freemium.
7. Tableau
Verdict: Tableau makes some of the best-looking visuals.
Best for: Interactive dashboards and storytelling with data.
Pros:
- Drag-and-drop design is easy to use.
- It handles large datasets well.
- It works on mobile devices.
Cons:
- It is weak at data cleaning.
- Paid plans cost more than many rivals.
Price tier: Paid. Tableau Public is free for public work.
8. Looker Studio
Verdict: Looker Studio is the best free choice for marketing reports.
Best for: Marketers and website owners.
Pros:
- It is free to use.
- It links directly to Google Analytics, Google Ads, and Sheets.
- You can share reports with a simple link.
Cons:
- It offers fewer advanced features than Power BI.
- Complex reports can load slowly.
Price tier: Free. A paid Pro version exists.
9. Qlik
Verdict: Qlik suits large companies that need deep data exploration.
Best for: Business intelligence teams.
Pros:
- It links data from many sources.
- Its engine helps users find hidden connections.
Cons:
- It costs more than most beginner tools.
- Small teams may find it too big.
Price tier: Paid.
No-Code and Statistical Tools
10. KNIME
Verdict: KNIME lets you build analysis without writing code.
Best for: Beginners in data mining and small teams on a budget.
Pros:
- You drag and drop blocks to build workflows.
- It connects with Python, R, and SQL.
- The core platform is free.
Cons:
- It does not scale as well as some enterprise tools.
- Some tasks still need coding knowledge.
Price tier: Free core platform. Paid business options exist.
11. IBM SPSS Statistics
Verdict: SPSS makes statistics simple through menus and clicks.
Best for: Students, researchers, and survey analysis.
Pros:
- You can run tests without coding.
- Universities use it widely.
Cons:
- The license is costly.
- Charts look dated compared with modern tools.
Price tier: Paid.
12. SAS
Verdict: SAS is a trusted choice for large, regulated industries.
Best for: Banking, healthcare, and enterprise analytics.
Pros:
- It is stable and reliable.
- It offers strong support and predictive tools.
Cons:
- It has a high price tag.
- Fewer new learners pick it than Python.
Price tier: Paid.
Big Data, Notebook, and AI Tools
13. Apache Spark
Verdict: Spark powers analysis when your data is truly huge.
Best for: Data engineers and big data projects.
Pros:
- It processes huge datasets across many computers.
- It supports Python, R, SQL, Scala, and Java.
- It includes tools for machine learning and streaming.
Cons:
- Setup is complex.
- It needs strong technical skills.
Price tier: Free and open-source. Cloud hosting costs extra.
14. Jupyter Notebook
Verdict: Jupyter is the best place to show your work step by step.
Best for: Learning, teaching, and sharing projects.
Pros:
- You can mix code, text, and charts on one page.
- It supports Python and R.
- It is perfect for portfolios.
Cons:
- Version control is weak.
- It is not ideal for large team projects.
Price tier: Free and open-source.
15. ChatGPT Data Analysis
Verdict: ChatGPT is the fastest way to get a first answer from a file.
Best for: Non-coders and quick checks.
Pros:
- You upload a file and ask questions in plain English.
- It writes Python code and builds charts for you.
- It saves hours on simple tasks.
Cons:
- It can make mistakes, so you must verify results.
- Private data may carry privacy risks.
Price tier: Freemium. Advanced features need a paid plan.
Master Comparison Table
| Tool | Type | Skill level | Free option? | Best for |
| Excel | Spreadsheet | Beginner | Limited | Everyday analysis |
| Google Sheets | Spreadsheet | Beginner | Yes | Team collaboration |
| Python | Programming | Intermediate | Yes | Flexible, deep analysis |
| R | Programming | Intermediate | Yes | Statistics and research |
| SQL | Query language | Beginner to intermediate | Yes | Database work |
| Power BI | BI tool | Beginner to intermediate | Yes (limited) | Business dashboards |
| Tableau | BI tool | Beginner to intermediate | Limited | Visual storytelling |
| Looker Studio | BI tool | Beginner | Yes | Marketing reports |
| Qlik | BI tool | Intermediate | No | Enterprise exploration |
| KNIME | Visual mining | Beginner | Yes | No-code workflows |
| SPSS | Statistical | Beginner to intermediate | No | Surveys and research |
| SAS | Statistical | Intermediate | No | Regulated industries |
| Apache Spark | Big data | Advanced | Yes | Huge datasets |
| Jupyter Notebook | Notebook | Intermediate | Yes | Sharing projects |
| ChatGPT | AI tool | Beginner | Limited | Fast answers |
Final Thought on This List
You do not need all 15 tools. Pick one from each group that fits your work. A common starter set is Excel, SQL, and Power BI. Add Python when you feel ready.
Next, we will cover the best free data analysis tools in detail.
Best Free Data Analysis Tools
You do not need a big budget to start analyzing data. Many of the best tools cost nothing. Students, freelancers, and small businesses use them every day. Some free tools even match the power of paid software.
This section covers the top free options, what they do well, and where they fall short. Free plans and limits change often, so check each official website before you commit.
Top Free Tools at a Glance
| Tool | Type | Best for | Skill level |
| Google Sheets | Spreadsheet | Simple analysis and teamwork | Beginner |
| Looker Studio | Dashboard | Marketing and website reports | Beginner |
| Power BI Desktop | Dashboard | Business reports on your own computer | Beginner to intermediate |
| Tableau Public | Visualization | Public charts and portfolios | Beginner to intermediate |
| KNIME | Visual mining | No-code data workflows | Beginner |
| Orange | Visual mining | Learning data mining and machine learning | Beginner |
| JASP | Statistical | Student and research statistics | Beginner |
| Python | Programming | Cleaning, analysis, and automation | Intermediate |
| R | Programming | Statistics and charts | Intermediate |
| Jupyter Notebook | Notebook | Sharing step-by-step projects | Intermediate |
Free Tools for Beginners
Google Sheets is the easiest place to begin. You need only a Google account. You can sort data, build pivot tables, and make charts. Several people can edit the same file at once, which makes it great for team projects.
Looker Studio helps you build clean reports without paying a cent. It connects directly to Google Analytics, Google Ads, and Google Sheets. Marketers love it because it turns website data into simple dashboards. You can share a report with a single link.
Orange and KNIME let you work without writing code. You drag blocks onto a screen and connect them. Orange has a friendly, colorful design that suits first-time learners. KNIME offers more depth and links with Python, R, and SQL.
Free Tools for Students and Researchers
JASP is a free choice for statistics. It runs common tests through simple menus. Many students use it instead of paid software like SPSS.
R is another strong pick. Packages like ggplot2 and dplyr give you powerful charts and tidy data. R takes more time to learn, but it rewards you with deep statistical control.
Free Tools for Aspiring Data Analysts
Python is free and open-source. Libraries like pandas, NumPy, and Matplotlib let you clean data, run analysis, and draw charts. Python also builds a strong base for machine learning later.
Jupyter Notebook works well alongside Python. You write code, add notes, and show charts on one page. This makes it perfect for a portfolio. Employers can read your steps and see how you think.
Power BI Desktop and Tableau Public help you practice dashboards. Power BI Desktop is free to download and use on your own computer. Tableau Public is free too, but it publishes your work online where anyone can see it. Never upload private or sensitive data to a public tool.
Free vs Paid Data Analysis Tools
| Point | Free tools | Paid tools |
| Cost | No license fee | Monthly or yearly fee |
| Best for | Learning, small projects, startups | Large teams and enterprises |
| Support | Community forums and guides | Official customer support |
| Features | Strong, but may have limits | More advanced and polished |
| Data limits | Sometimes limited | Usually higher |
| Examples | Python, R, KNIME, Looker Studio | SAS, SPSS, Tableau, Qlik |
Hidden Costs of Free Tools
Free does not always mean zero cost. Keep these points in mind:
- Learning time: Python and R take weeks or months to learn well.
- Setup effort: Open-source tools may need installation and updates.
- Limited support: You rely on forums and documents, not a help desk.
- Plan limits: Some freemium tools cap data size or hide features behind a paid plan.
- Privacy: Public tools can expose your data if you share carelessly.
How to Pick the Right Free Tool
Start with your goal. If you want quick reports, choose Google Sheets or Looker Studio. If you want a career in data, learn Python and practice with Jupyter Notebook. If you study statistics, try JASP or R. If you dislike coding, test KNIME or Orange.
You can mix tools too. Many analysts clean data in Python, store results in Google Sheets, and show them in Looker Studio. All three are free.
Free tools can take you very far. When your team grows or your data gets huge, you can upgrade to paid software.
AI Data Analysis Tools: What Has Changed in 2026
AI has changed how people work with data. A few years ago, you needed code or advanced formulas to answer a simple question. Today, you can type the question in plain English and get an answer in seconds.
This shift helps beginners the most. It also saves experts hours of routine work. But AI is not magic. It makes mistakes, and you must check its results. This section shows what AI can do, where it fails, and how to use it safely.
What Are AI Data Analysis Tools?
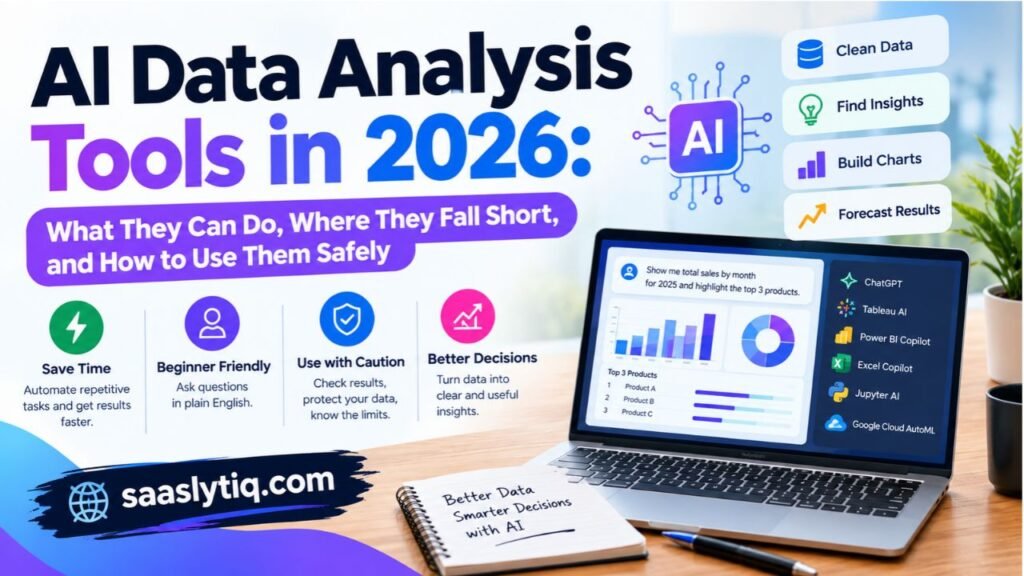
AI data analysis tools use machine learning and large language models to study data for you. You upload a file or connect a data source. You then ask questions in everyday language. The tool writes the code, builds the charts, and explains the results.
Some tools are built on AI from the start. Others add AI features to software you already know. Here are the main examples.
| Tool | What the AI does | Best for |
| ChatGPT data analysis | Reads uploaded files, writes Python code, and builds charts | Quick answers and non-coders |
| Tableau AI | Suggests insights and helps explore dashboards | Business users |
| Power BI Copilot | Creates reports and answers questions in plain English | Microsoft users |
| Excel Copilot | Writes formulas and summarizes tables | Spreadsheet users |
| Jupyter AI | Helps write and fix code inside notebooks | Coders and students |
| Google Cloud AutoML | Builds machine learning models with little coding | Teams new to machine learning |
Features and plan names change quickly, so check each official site for the latest details.
What Can AI Do for Data Analysis?
AI handles many boring and repeated tasks well. Here are its strongest uses.
- Clean data faster. AI spots duplicates, missing values, and odd formats. It then suggests fixes.
- Write code for you. You describe the task, and AI writes the Python, SQL, or Excel formula.
- Find quick insights. AI scans your data and points out trends you might miss.
- Spot anomalies. It flags strange values, such as a sudden sales drop or a possible fraud case.
- Forecast results. It uses past data to predict future numbers.
- Explain charts in plain words. It turns a graph into a short summary anyone can read.
Traditional vs AI-Assisted Workflow
| Point | Traditional workflow | AI-assisted workflow |
| Speed | Slow for repeated tasks | Fast for first drafts |
| Skill needed | Coding or formula knowledge | Clear questions in plain English |
| Data cleaning | Manual steps | Automatic suggestions |
| Chart creation | You build each chart | AI builds charts from a prompt |
| Accuracy risk | Human error | AI errors and wrong assumptions |
| Cost | Software license and time | Subscription and time to verify |
| Control | Full control over each step | Less control unless you review the code |
Where AI Still Falls Short
AI helps a lot, but it has clear limits. Keep these in mind.
- It can be wrong. AI sometimes gives confident answers that are false. Always test the results.
- It lacks business context. AI does not know your company, your goals, or your customers. You do.
- It can misread messy data. Bad data in means bad answers out.
- It raises privacy risks. Uploading customer details or private company files to an AI tool can break rules and policies.
- It cannot replace judgment. AI finds patterns. People decide what those patterns mean.
How to Use AI for Data Analysis Safely
Follow these simple steps for better and safer results.
- Remove private data first. Delete names, emails, phone numbers, and financial details before you upload a file.
- Check your company policy. Many workplaces limit which AI tools you can use.
- Ask clear questions. Specific prompts give better answers.
- Review the code and the numbers. Spot-check a few results by hand.
- Ask for the steps. Request an explanation so you understand how the tool reached its answer.
- Keep a human in charge. Use AI as your assistant, not your boss.
Example of a Good Prompt
A weak prompt looks like this: “Analyze my sales.”
A strong prompt looks like this: “Use the attached sales file. Show total revenue by month for 2025. Find the three best-selling products. Make a line chart for revenue and explain any big changes in simple words.”
The second prompt works better because it sets the data, the task, the output, and the tone.
Will AI Replace Data Analysts?
AI will change jobs, but it will not remove the need for skilled people. Routine tasks like cleaning data and writing basic queries will take less time. Analysts will spend more time on strategy, questions, and communication. They must also check AI output and explain it to others.
The best approach is to learn both. Build a strong base in Excel, SQL, and Python. Then add AI tools to work faster. Analysts who combine both skills will stay valuable.
Quick Summary
| Question | Short answer |
| Can AI analyze my data? | Yes, for many tasks, but it needs human review. |
| Is it good for beginners? | Yes. Plain-English prompts lower the barrier. |
| Is it safe for private data? | Not always. Remove sensitive details first. |
| Should I still learn SQL and Python? | Yes. They help you check and control AI results. |
AI tools give you speed. Your skills give you trust. Use both, and you will get better answers in less time.
How to Choose the Right Data Analysis Tool
Picking a tool feels hard when so many options exist. The good news is that you do not need to test them all. A simple process will narrow your list in minutes.
No single tool is best for everyone. The right choice depends on your goal, your skills, your data, and your budget. Follow these five steps, and you will make a smart decision.
Step 1: Define Your Goal
Start with one question. What do you want to do with your data?
Your answer shapes everything else. A student who needs to run a survey test needs a different tool than a marketer who builds weekly reports. Write your main goal in one sentence before you look at any software.
| Your goal | Tool type to look at |
| Clean and sort small files | Spreadsheets |
| Build reports and dashboards | BI tools |
| Run statistical tests | Statistical software |
| Build prediction models | Python, R, or AutoML |
| Process huge datasets | Big data tools |
| Get quick answers | AI-powered tools |
Step 2: Check Your Skill Level
Be honest about where you are today. A tool that is too hard will slow you down. A tool that is too basic will limit you.
- Beginner: Choose Excel, Google Sheets, Looker Studio, KNIME, or an AI tool.
- Intermediate: Add SQL, Power BI, Tableau, or SPSS.
- Advanced: Use Python, R, Apache Spark, or dbt.
You can always grow into harder tools later. Many analysts begin with Excel and add SQL and Python over time.
Step 3: Look at Your Data Size and Type
Data size matters more than most people think. Excel handles small and medium files well. It struggles with millions of rows. Python, SQL databases, and cloud tools like Snowflake and Google BigQuery handle far more.
Also check the type of data you have.
- Structured data sits in tidy rows and columns. Spreadsheets and SQL work well here.
- Unstructured data includes text, images, and social media posts. Python, R, and specialized tools work better.
- Live data updates all the time. Dashboard tools and streaming tools like Apache Spark can help.
Step 4: Set Your Budget
Costs range from zero to thousands of dollars per year. Decide how much you can spend before you shop.
- Free: Python, R, SQL, KNIME, Looker Studio, JASP, and Google Sheets.
- Freemium: Power BI and ChatGPT offer free or low-cost entry points.
- Paid: SAS, SPSS, Tableau, and Qlik usually need a license.
Remember the hidden costs too. Training time, setup, and team licenses can add up. A free tool is not always the cheapest once you count your time.
Step 5: Think About Your Team and Your Tech Stack
A tool must fit the way you work. Ask these questions.
- Does your team already use Microsoft products? Power BI and Excel may fit best.
- Does your company use Google tools? Looker Studio and Google Sheets connect easily.
- Do others need to view your reports? Pick a tool that shares dashboards with a link.
- Does the tool connect to your data sources? Check for links to your database, CRM, or ad platforms.
- Can you find help and training? A large community makes learning easier.
Decision Matrix: Which Tool Fits You?
| Your situation | Best first choice | Good backup |
| Complete beginner on a zero budget | Google Sheets | Looker Studio |
| Student running surveys | JASP | SPSS or R |
| Aspiring data analyst | SQL and Python | Power BI |
| Marketer tracking campaigns | Looker Studio | Google Analytics with Sheets |
| Small business owner | Excel | Power BI |
| Business analyst in a Microsoft office | Power BI | Excel |
| Researcher needing deep statistics | R | SPSS or Stata |
| Data engineer with huge data | Apache Spark | Snowflake or BigQuery |
| Non-coder who wants fast answers | ChatGPT data analysis | KNIME |
Common Mistakes to Avoid
Many people make the same errors when they pick a tool. Avoid these traps.
- Chasing trends. The newest tool is not always the best one for you.
- Ignoring data size. A tool that works on 1,000 rows may fail on 1,000,000.
- Skipping SQL. Most companies store data in databases, so SQL opens many doors.
- Paying for unused features. Start small and upgrade only when you need more.
- Using one tool for everything. Most professionals use two or three tools together.
- Skipping a free trial. Test a tool with your own data before you commit.
A Simple Rule to Remember
When in doubt, start simple. Learn Excel or Google Sheets first. Add SQL next. Then pick a dashboard tool like Power BI or Tableau. Move to Python when you want more power. This path works for most people, and it builds skills step by step.
Best Data Analysis Tools by Role
Different jobs need different tools. A marketer does not need the same setup as a data engineer. Picking tools based on your role saves time and keeps you focused on what matters.
This section shows the best tool stack for each role. A stack is a small group of tools that work well together. Start with the basics for your role, then add more as your skills grow.
Tool Stack by Role at a Glance
| Role | Core tools | Add later |
| Data analyst | SQL, Excel, Power BI or Tableau | Python, Jupyter Notebook |
| Business analyst | Excel, Power BI | SQL, Tableau |
| Digital marketer | Google Analytics, Looker Studio, Google Sheets | SQL, Python |
| Academic researcher | SPSS or R, Jupyter Notebook | Python, JASP |
| Data scientist | Python, Jupyter Notebook, SQL | R, Apache Spark |
| Data engineer | SQL, Apache Spark, dbt | Snowflake, Google BigQuery |
| Small business owner | Excel or Google Sheets | Power BI, Looker Studio |
| Student or beginner | Google Sheets, Excel | SQL, Python |
Data Analyst
Data analysts find answers in data and share them with teams. They spend much of their day cleaning data, writing queries, and building reports.
SQL is the first skill to learn. It pulls data from databases such as MySQL and PostgreSQL. Excel helps with quick checks and pivot tables. Power BI or Tableau turns results into dashboards that managers can read. Later, add Python with pandas and Matplotlib for deeper work.
This stack matches what many data analyst job posts ask for. It is also a strong base for a portfolio.
Business Analyst
Business analysts study how a company works and suggest ways to improve it. They focus on processes, costs, and goals more than code.
Excel is the main tool here. It handles budgets, forecasts, and trend checks. Power BI helps share clear reports with leaders. Many business analysts also learn basic SQL to pull data without waiting for another team.
Digital Marketer
Marketers need to know what works and what wastes money. They track traffic, leads, and sales from many channels.
Google Analytics shows how people find and use your website. Looker Studio turns that data into easy reports, and it is free. Google Sheets stores and cleans campaign numbers. When you want more depth, learn basic SQL and Python to handle large ad data.
This stack is mostly free, which suits small teams and freelancers.
Academic Researcher
Researchers test ideas and prove results. They need tools that handle statistics with care.
SPSS lets you run tests through menus, so you do not need to code. R gives you more control and powerful charts through packages like ggplot2. JASP is a free option that many students enjoy. Jupyter Notebook helps you share your steps so others can repeat your work.
Good research needs clear methods. Choose a tool that lets you record and explain each step.
Data Scientist
Data scientists build models that predict future results. They mix coding, statistics, and business sense.
Python is the main tool, with libraries like pandas, NumPy, and scikit-learn. Jupyter Notebook lets them test ideas and show results in one place. SQL pulls the data. For very large projects, Apache Spark speeds up the work. Some also use R for statistical tasks.
Data Engineer
Data engineers build the systems that collect and move data. Analysts and scientists depend on their work.
SQL is a must. Apache Spark processes large datasets across many computers. dbt helps transform data inside a data warehouse using simple SQL. Cloud platforms like Snowflake and Google BigQuery store data at scale.
This path needs strong technical skills, but it pays well and stays in demand.
Small Business Owner
You may not have time to learn complex software. You need quick answers about sales, costs, and customers.
Excel or Google Sheets covers most needs. Use pivot tables to see your best products and slow months. When you want live dashboards, try Power BI or Looker Studio. You can also use an AI tool to ask simple questions about your sales file. Just remove private customer details first.
Student or Beginner
Start small and build step by step.
Begin with Google Sheets or Excel to learn the basics. Then pick up SQL, which is easy to learn and very useful. Next, try a free dashboard tool like Looker Studio or Power BI Desktop. When you feel ready, learn Python and practice in the Jupyter Notebook. Save your projects, because they can become your portfolio.
Tips for Building Your Own Stack
- Start with two tools, not ten. Master the basics before you add more.
- Choose tools that connect. For example, SQL feeds Power BI, and Python feeds Jupyter.
- Follow your job market. Check job posts in your area and learn the tools they list.
- Practice on real data. Use free public datasets to build projects.
- Review your stack each year. Tools change, and so do your needs.
Your role gives you a clear starting point. You can always grow your stack as your work changes.
Real Example: One Dataset, Three Tools
Reading about tools is useful. Seeing them work is better. In this section, we use one small sales file and answer the same questions in three tools: Excel, Python, and Power BI.
The data below is a simple sample for teaching. It shows how each tool thinks and feels in daily use.
The Sample Dataset
A small shop sells three products. The owner wants to know two things.
- Which product earns the most money?
- How do sales change from month to month?
| Date | Product | Units sold | Price (USD) |
| Jan 2026 | Notebook | 100 | 5 |
| Jan 2026 | Pen | 200 | 2 |
| Jan 2026 | Bag | 20 | 25 |
| Feb 2026 | Notebook | 120 | 5 |
| Feb 2026 | Pen | 150 | 2 |
| Feb 2026 | Bag | 30 | 25 |
| Mar 2026 | Notebook | 90 | 5 |
| Mar 2026 | Pen | 250 | 2 |
| Mar 2026 | Bag | 40 | 25 |
Revenue equals units sold times price. We need that number first in every tool.
The Answer We Expect
Here is the result, so you can check each tool against it.
| Product | Units sold | Total revenue |
| Bag | 90 | $2,250 |
| Notebook | 310 | $1,550 |
| Pen | 600 | $1,200 |
| Total | 1,000 | $5,000 |
| Month | Revenue |
| January | $1,400 |
| February | $1,650 |
| March | $1,950 |
Two facts stand out. The bag earns the most money, even though it sells the fewest units. Monthly revenue also grows by about 39 percent from January to March.
Tool 1: Microsoft Excel
Excel is the fastest way to get a first answer from a small file.
Steps:
- Open the data in a sheet.
- Add a new column named Revenue. Type the formula =C2*D2 and fill it down.
- Select the data and insert a pivot table.
- Drag Product to rows and Revenue to values.
- Make a second pivot table with Month in rows to see the monthly trend.
- Insert a bar chart for products and a line chart for months.
What we liked: You see results right away. You also need no setup and no code.
What to watch: You repeat these steps by hand each time new data arrives. Large files may also slow Excel down.
Tool 2: Python
Python takes a little more effort at the start. In return, you can reuse the same code again and again.
Steps: Save the data as a CSV file named sales.csv, then run this code.
python
import pandas as pd
df = pd.read_csv(“sales.csv”, parse_dates=[“Date”])
df[“Revenue”] = df[“Units”] * df[“Price”]
by_product = df.groupby(“Product”)[“Revenue”].sum().sort_values(ascending=False)
by_month = df.groupby(df[“Date”].dt.to_period(“M”))[“Revenue”].sum()
print(by_product)
print(by_month)
by_product.plot(kind=”bar”)
What we liked: The code runs in seconds on 9 rows or 9 million rows. You can run it again next month with a fresh file.
What to watch: You must know basic coding. A small typo can stop the script, so read error messages carefully.
Tool 3: Microsoft Power BI
Power BI turns the same data into a dashboard that other people can explore.
Steps:
- Open Power BI Desktop and choose Get Data, then Text/CSV.
- Load the file and check the columns in Power Query.
- Create a measure with this formula: Total Revenue = SUMX(Sales, Sales[Units] * Sales[Price])
- Add a bar chart with Product and Total Revenue.
- Add a line chart with Month and Total Revenue.
- Add a slicer so viewers can filter by product.
What we liked: The dashboard looks polished. Viewers can click, filter, and explore on their own.
What to watch: The formula language, DAX, takes time to learn. Sharing reports online may need a paid plan.
Side-by-Side Comparison
| Point | Excel | Python | Power BI |
| Time to first answer | Very fast | Medium | Medium |
| Learning curve | Low | Medium to high | Medium |
| Handles big data | Limited | Strong | Strong |
| Repeat the work later | Manual steps | Run the same script | Refresh the data |
| Sharing with others | Send the file | Share code or charts | Share a live dashboard |
| Chart quality | Good | Customizable | Very good |
| Cost | Paid | Free | Free desktop, paid sharing |
| Best for | Quick checks | Automation and deep analysis | Team dashboards |
What This Example Teaches
All three tools gave the same answer. The bag wins on revenue, and sales grow each month. The difference lies in the journey.
- Use Excel when you need a quick answer from a small file.
- Use Python when you want to repeat the work or handle large data.
- Use Power BI when you want to share an interactive report with a team.
Most analysts use all three over time. They clean data in Python, check it in Excel, and present it in Power BI.
Try It Yourself
Copy the sample table into a spreadsheet. Then follow the steps in one tool. Next, try a second tool with the same file. This small exercise teaches more than hours of reading.
Common Mistakes When Choosing and Using Data Analysis Tools
Even smart people make mistakes with data tools. Some pick the wrong software. Others use the right software in the wrong way. Both errors waste time and can lead to bad decisions.
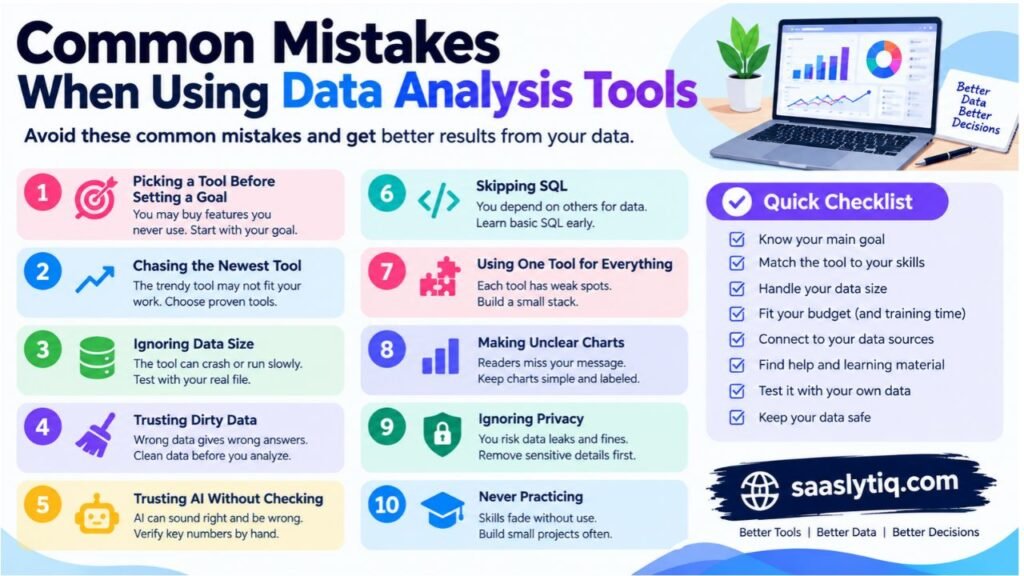
This section covers the most common mistakes and how to fix each one. Read it before you commit to a tool, and again after a few months of use.
Quick Overview of the Mistakes
| Mistake | Why it hurts | Simple fix |
| Choosing a tool before defining the goal | You buy features you never use | Write your goal first |
| Following trends | The trendy tool may not fit your work | Match the tool to your needs |
| Ignoring data size | The tool crashes or runs slowly | Test with your real file |
| Trusting dirty data | Wrong data gives wrong answers | Clean data before you analyze |
| Trusting AI without checking | AI can sound right and be wrong | Verify key numbers by hand |
| Skipping SQL | You depend on others for data | Learn basic SQL early |
| Using one tool for everything | Each tool has weak spots | Build a small stack |
| Making unclear charts | Readers miss your message | Keep charts simple and labeled |
| Ignoring privacy | You risk data leaks and fines | Remove sensitive details first |
| Never practicing | Skills fade without use | Build small projects often |
Mistake 1: Picking a Tool Before Setting a Goal
Many people start by browsing software. They watch reviews, compare prices, and feel lost. The better way is to start with your question.
Do you need a weekly sales report? Do you need to test a survey result? Do you need to predict next year’s demand? Each goal points to a different tool. Write your goal in one sentence first. Then shop.
Mistake 2: Chasing the Newest Tool
New tools appear every month. Some are excellent, but many are not ready for real work. A new tool may lack support, training, or stable features.
Choose tools with a track record. Excel, SQL, Python, Power BI, and Tableau have large communities. You can find answers fast when you get stuck. Try new tools on the side, but keep your daily work on proven ones.
Mistake 3: Ignoring Data Size
A tool that works for 1,000 rows may fail at 1,000,000. Excel, for example, slows down with very large files. Free dashboard plans may also cap how much data you can load.
Test every tool with a real file before you decide. Check how fast it opens, filters, and refreshes. If your data keeps growing, plan for tools like SQL databases, Python, Snowflake, or Google BigQuery.
Mistake 4: Skipping Data Cleaning
The best tool cannot fix bad data. Duplicate rows, missing values, and mixed date formats all lead to wrong results.
Always check your data first. Look for these problems.
- Duplicate records
- Empty cells
- Typos in names or categories
- Dates in different formats
- Numbers stored as text
- Extreme values that look wrong
Spend time on cleaning. Analysts often say it takes most of the project, and that is normal.
For spreadsheet-based projects, tools such as Excel Power Query can help you transform and prepare data before analysis.
Mistake 5: Trusting AI Without Checking
AI tools save time, but they can make errors. They may misread a column, pick the wrong formula, or invent a trend that does not exist.
Treat AI like a fast new intern. It helps a lot, but you still review the work. Spot-check totals, read the code if the tool shows it, and compare results with a second method. If a number looks strange, test it again.
Mistake 6: Skipping SQL
Many beginners jump to dashboards and Python. They skip SQL because it feels dull. This choice hurts later.
Most companies store data in databases. SQL lets you pull exactly the data you need. Without it, you wait for others to send files. Basic SQL takes only a few weeks to learn. It also appears in many data analyst job posts.
Mistake 7: Using One Tool for Everything
No tool does every job well. Excel struggles with huge data. Tableau is weak at cleaning. Python needs more work for quick charts.
Build a small stack instead. A common mix looks like this.
| Task | Good tool |
| Pull data | SQL |
| Clean and analyze | Python or Excel |
| Present results | Power BI, Tableau, or Looker Studio |
Pick tools that connect well, so data flows between them without pain.
If you are comparing analytics platforms, our guide to Data Analysis Tools in 2026: 15 Best Options Compared can help you explore different options for your workflow.
Mistake 8: Making Charts That Confuse
A chart should make your point clear in seconds. Many charts do the opposite. They use too many colors, too many labels, or the wrong chart type.
Follow these simple rules.
- Use a line chart for trends over time.
- Use a bar chart to compare categories.
- Limit each chart to one main message.
- Add a clear title and labeled axes.
- Avoid 3D effects and busy backgrounds.
- Start bar charts at zero so the sizes look fair.
If you use Power BI to present your findings, the official Power BI reporting and dashboard documentation provides guidance on creating and formatting reports.
Mistake 9: Ignoring Privacy and Security
Data often holds names, emails, phone numbers, and payment details. Careless handling can break laws and harm people.
Protect your data with these habits.
- Remove personal details when you do not need them.
- Read your company policy before you use online or AI tools.
- Avoid public tools such as Tableau Public for private data.
- Use strong passwords and limit who can see each file.
Mistake 10: Learning Tools Without Practice
Watching tutorials feels productive, but skills grow only when you use them. Many learners finish a course and still cannot solve a real problem.
Build small projects instead. Use free public datasets on topics you enjoy, such as sports, movies, or local weather. Clean the data, answer three questions, and make one chart. Save each project in a portfolio. This habit builds confidence and impresses employers.
A Simple Checklist Before You Choose
Ask yourself these questions before you commit to any tool.
| Question | Yes or no |
| Do I know my main goal? | |
| Does the tool match my skill level? | |
| Can it handle my data size? | |
| Does it fit my budget, including training time? | |
| Does it connect to my data sources? | |
| Can I find help and learning material? | |
| Did I test it with my own data? | |
| Is my data safe with this tool? |
If you answer yes to most, you are on the right track.
Final Thought
Mistakes are normal, and every analyst makes them. What matters is how fast you spot and fix them. Stay curious, check your work, and keep your tools simple. These habits will protect you far better than any expensive software.
Learning Roadmap for Beginners: Your 90-Day Plan
You know the tools. Now you need a plan to learn them. Many beginners try to learn everything at once. They jump between Excel, Python, and Power BI, and they feel lost within weeks.
A clear roadmap fixes this. This 90-day plan teaches one skill at a time. Each step builds on the last. You need about one hour a day, or seven to ten hours a week. Move at your own pace. If a step takes longer, that is fine.
The 90-Day Plan at a Glance
| Weeks | Main focus | Tools | Goal at the end |
| 1 to 3 | Data basics and cleaning | Excel or Google Sheets | Clean a messy file and build a pivot table |
| 4 to 6 | Getting data from databases | SQL | Write queries that filter, group, and join data |
| 7 to 9 | Deeper analysis and automation | Python (pandas) | Analyze a dataset and make charts with code |
| 10 to 12 | Dashboards and portfolio | Power BI, Tableau, or Looker Studio | Publish two projects with clear findings |
Weeks 1 to 3: Learn the Basics with a Spreadsheet
Start with Excel or Google Sheets. They are easy to open and forgiving for new learners. Your goal is to understand how data looks and how to prepare it.
What to learn:
- Rows, columns, and data types
- Sorting and filtering
- Removing duplicates and fixing blank cells
- Core formulas such as SUM, AVERAGE, IF, COUNTIF, SUMIF, and VLOOKUP or XLOOKUP
- Pivot tables and basic charts
Practice task: Download a free sales or survey dataset. Clean it. Then build a pivot table that shows total sales by product and by month.
Check yourself: Can you explain your pivot table to a friend in two minutes? If yes, move on.
Weeks 4 to 6: Learn SQL
SQL lets you pull data from databases. It is simple to read, and it opens many doors. You do not need a big setup. Free tools like SQLite, MySQL, or PostgreSQL work well.
What to learn:
- SELECT, FROM, and WHERE
- ORDER BY and LIMIT
- GROUP BY with SUM, COUNT, and AVG
- JOIN to combine tables
- Simple subqueries
Practice task: Load a sample database with customers, orders, and products. Answer five questions. For example, which product sold the most last month? Which customers placed more than three orders?
Check yourself: Can you join two tables and group the result without help? If yes, move on.
Weeks 7 to 9: Learn Python for Data Analysis
Python adds power and speed. You do not need to master the whole language. Focus on the parts that matter for data work.
What to learn:
- Basic Python: variables, lists, loops, and functions
- pandas to load, clean, filter, and group data
- NumPy for simple math
- Matplotlib to draw charts
- Jupyter Notebook to write code and notes together
Practice task: Take the same dataset you used in Excel. Repeat the cleaning and analysis in Python. Compare the results. This shows you how each tool thinks.
Check yourself: Can you load a CSV file, clean it, and make a chart in a notebook? If yes, move on.
Weeks 10 to 12: Build Dashboards and Your Portfolio
Now you turn analysis into stories that others can read. Pick one dashboard tool and stay with it. Power BI Desktop and Looker Studio are free. Tableau Public is free but makes your work public.
What to learn:
- Connecting a dashboard tool to a file or database
- Choosing the right chart for each question
- Using filters and slicers
- Writing a short summary of what the data shows
Practice task: Build a dashboard for one project. Add three charts, one filter, and a short written insight. Then write a one-page summary that explains your question, your method, and your result.
Check yourself: Can a stranger understand your dashboard in under a minute? If yes, you are ready to share it.
Weekly Routine You Can Follow
| Day | Activity | Time |
| Monday to Thursday | Learn one new topic and practice it | 45 to 60 minutes |
| Friday | Review the week and fix mistakes | 45 minutes |
| Saturday | Work on a small project | 1 to 2 hours |
| Sunday | Rest or read about data topics | Optional |
Short, steady sessions beat long, rare ones. Your brain learns best with regular practice.
Project Ideas for Your Portfolio
Projects prove your skills better than certificates. Pick topics you enjoy, because you will work harder on them.
| Level | Project idea | Tools |
| Beginner | Personal budget tracker | Google Sheets |
| Beginner | Survey results summary | Excel |
| Intermediate | Movie ratings analysis | SQL and Python |
| Intermediate | Local weather trends | Python and Jupyter Notebook |
| Intermediate | Online store sales dashboard | Power BI or Looker Studio |
| Advanced | Customer segmentation | Python |
Save each project in a public place, such as a portfolio page or a code-sharing site. Add a short description, your steps, and what you learned. Never include private or sensitive data.
Tips to Stay on Track
- Set small goals. Aim to finish one lesson a day, not a whole course.
- Practice on real data. Free public datasets exist on many topics.
- Do not copy and paste blindly. Type the code yourself and read each line.
- Ask for help early. Use community forums and study groups when you get stuck.
- Track your progress. Write down what you learned each week.
- Be patient. Everyone feels confused at first. That feeling fades with practice.
What Comes After 90 Days?
You will not be an expert after three months, but you will have a solid base. From here, you can go in several directions.
| Next step | What to do |
| Go deeper in statistics | Learn hypothesis testing and regression with R or Python |
| Aim for a job | Polish your resume, portfolio, and LinkedIn profile |
| Try machine learning | Study scikit-learn and basic prediction models |
| Explore AI tools | Use AI to speed up routine tasks, and check the results |
| Work with big data | Learn Apache Spark, Snowflake, or Google BigQuery |
Final Thought
You do not need talent to learn data analysis. You need a plan and steady practice. Follow this roadmap, build real projects, and keep learning. In 90 days, you will move from beginner to confident.
Frequently Asked Questions About Data Analysis Tools
People ask many questions before they pick a data analysis tool. This section gives short, clear answers to the most common ones. Each answer is simple, so you can find what you need fast.
What are the best tools for data analysis?
The best tool depends on your goal. For most people, the top choices are Microsoft Excel, SQL, Python, Power BI, and Tableau. Excel suits quick work. SQL pulls data from databases. Python handles deep analysis and automation. Power BI and Tableau build dashboards. Beginners should start with Excel or Google Sheets.
Which data analysis tool is best for beginners?
Excel and Google Sheets are the easiest to start with. They are simple, familiar, and need no coding. Looker Studio is also beginner-friendly for marketing reports. If you prefer no code but want more power, try KNIME or Orange. After the basics, learn SQL as your next step.
What is the difference between data analysis tools and data analytics tools?
The two terms mean almost the same thing, and people use them together. “Data analysis” often refers to studying data to find answers. “Data analytics” is a broader word. It can include collecting, storing, studying, and predicting with data. In daily work, you can treat both terms as the same group of software.
Is SQL a data analysis tool?
Yes. SQL is a language that pulls, filters, and organizes data in databases. It does not make charts on its own. Still, most analysts use it every day, because most company data lives in databases. SQL works best alongside tools like Excel, Python, or Power BI.
Are there good free data analysis tools?
Yes. Many strong tools cost nothing. Python, R, SQL, KNIME, Orange, JASP, Looker Studio, and Google Sheets are all free. Power BI Desktop and Tableau Public are also free to use, with some limits. Free tools work well for learning, small projects, and many business needs.
Should I learn Python or R?
Both are good, but Python suits most beginners. It is easier to read and has more uses beyond data work. R is excellent for statistics and research, and many universities teach it. If you want a data analyst or data scientist job, Python is usually the safer pick. If you work in academic research, R may fit better.
Is Excel still useful for data analysis?
Yes. Excel remains one of the most used tools in the world. It handles cleaning, pivot tables, charts, and basic statistics. It has limits with very large files. Still, most analysts use Excel every week, even when they also use Python or SQL.
Power BI or Tableau: which is better?
Both are strong. Power BI works smoothly with Excel and other Microsoft products. It often costs less. Tableau is known for beautiful visuals and flexible design. Choose Power BI if your company uses Microsoft tools. Choose Tableau if visual design is your top priority. Check your job market too, because demand differs by region.
Can AI replace data analysts?
AI will change the work, but it will not remove the need for skilled people. AI handles routine tasks like cleaning data and writing simple queries. Analysts still ask the right questions, check the results, and explain the meaning to others. People who learn both core skills and AI tools will stay valuable.
Do I need to know coding to analyze data?
No. You can analyze data with Excel, Google Sheets, Power BI, Tableau, Looker Studio, KNIME, and many AI tools without writing code. Coding helps when your data is large or your tasks repeat often. It also opens more job options. You can start without code and learn it later.
How long does it take to learn data analysis tools?
You can learn the basics of Excel in a few weeks. SQL takes about three to six weeks of regular practice. Python takes longer, often two to three months for the data basics. Dashboard tools like Power BI take a few weeks to start. With one hour a day, the 90-day plan in this guide can give you a solid base.
Which data analysis tool do companies use the most?
Companies use many tools, but Excel, SQL, Power BI, Tableau, and Python appear most often in job posts and daily work. Large firms may also use SAS, Qlik, or cloud platforms like Snowflake and Google BigQuery. The exact mix depends on the industry and team size.
Are AI data analysis tools safe to use?
They can be safe if you use them with care. Remove names, emails, phone numbers, and payment details before you upload a file. Read your company policy first. Choose tools from trusted providers and check their privacy terms. Always verify the results, because AI can make mistakes.
Conclusion
Data analysis tools help you turn raw numbers into clear decisions. The right tool saves time, cuts errors, and makes your work easier to share. The wrong tool slows you down. That is why a smart choice matters.
This guide showed you that no single tool wins for everyone. Excel and Google Sheets suit beginners. SQL and Python give you power and flexibility. Power BI, Tableau, and Looker Studio turn data into dashboards. R, SPSS, and JASP serve researchers. Apache Spark handles huge datasets. AI tools give fast answers, but you must check their results.
Start with your goal. Match the tool to your skill level, data size, and budget. Then begin small. Learn one tool at a time, practice on real data, and build projects you can show others. A simple path works for most people: spreadsheets first, then SQL, then a dashboard tool, then Python.
[…] these mistakes by combining allintitle: searches with careful SERP analysis and relevant SEO data. This approach helps you select keywords based on real opportunities rather than a single search […]
[…] and changes in the technology industry. These topics can help readers understand how business and technology affect everyday […]